\(f(x) = \begin{cases} k(x) &\text{if }x>3, \\ x^2-6x+12&\text{if }x\leq3. \end{cases}\)
The LaTex for this question is really cool. I've not seen this code before.
f(x) = \begin{cases} k(x) &\text{if }x>3, \\ x^2-6x+12&\text{if }x\leq3. \end{cases}
----------------------------------------
\(y=x^2-6x+12\\ y=x^2-6x+9+3\\ y=(x-3)^2+3\\ y-3=(x-3)^2\\ \pm \sqrt{y-3}=x-3 \qquad where\;\;y\ge3\\ x=\pm \sqrt{y-3}+3\\ \text{The desired inverse will be one of these.}\\ y=\pm \sqrt{x-3}+3\\ \text{BUT is it the plus or the minus?}\)
Consider f(0)=12
The reflection of (0,12) in the line y=x (which is the inverse) is (12,0)
This works when the sign is negative.
so this underneath will be its own inverse.
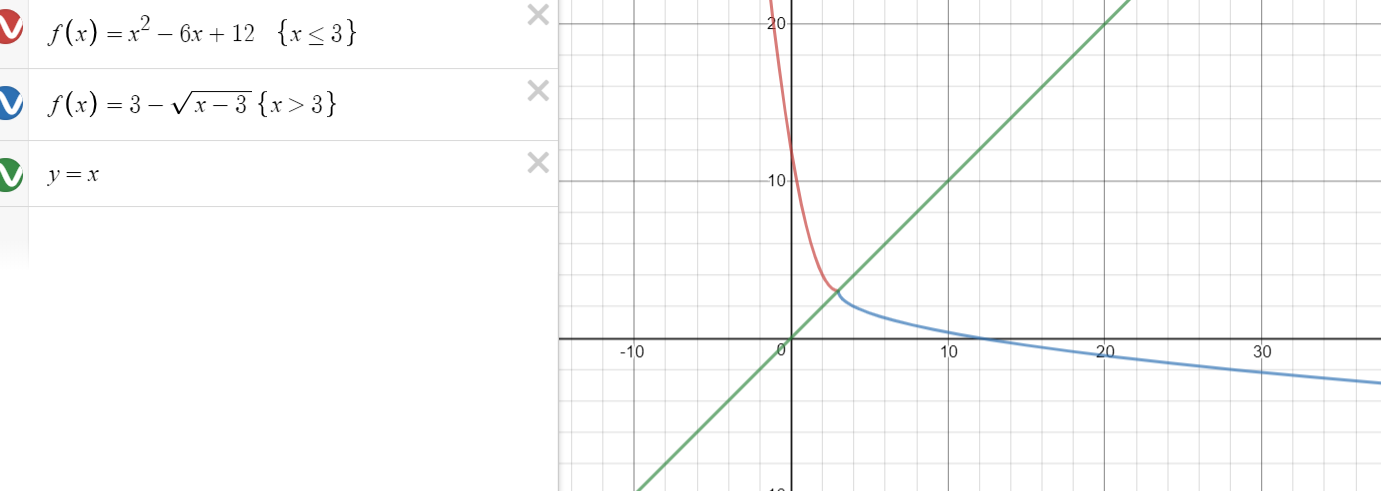
\(f(x) = \begin{cases}3 -\sqrt{x-3} &\text{if }x>3, \\ x^2-6x+12&\text{if }x\leq3. \end{cases} \)
And here is the graph:


 +118725
  +118725