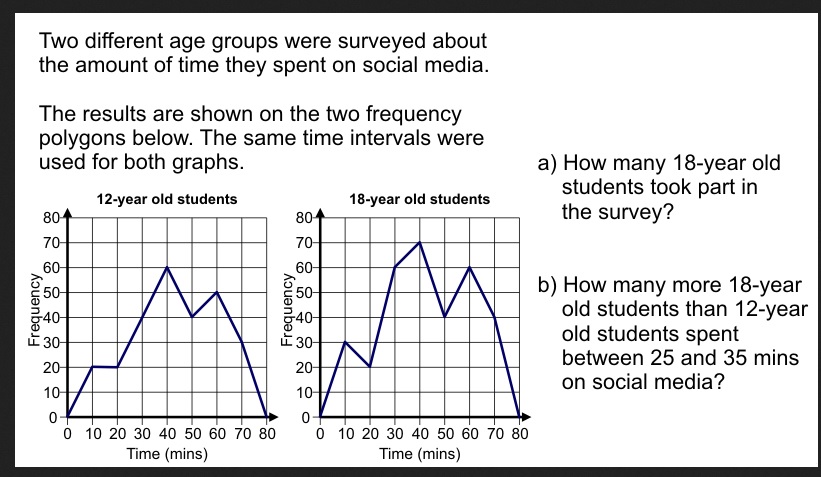
Look at the data points graphed for the 18 year olds at x = 10 minutes the number of 18 year olds is 30
at x = 20 minutes the number of 18 year olds is 20
at x = 30 min is 60
continue with the other data points and add up all of the 18 y/o's
b. Look at x = 30 for both of the graphs and find the
'y' values and see which is greater....